Import Data
Import Genome File
The genome data can be used to generate karyotype data for circos plotting and draw snail plot.
Go to File menu -> Import Data -> Import Genome File… to select a FASTA formatted genome file (gzip compressed genome file supported). The imported genome data has five columns: id, chrom, length, gc, ns.
Column |
Description |
|---|---|
id |
chromosome id generated by circhart |
chrom |
chromosome name |
length |
total number of bases |
gc |
GC contents |
ns |
number of unknown bases |
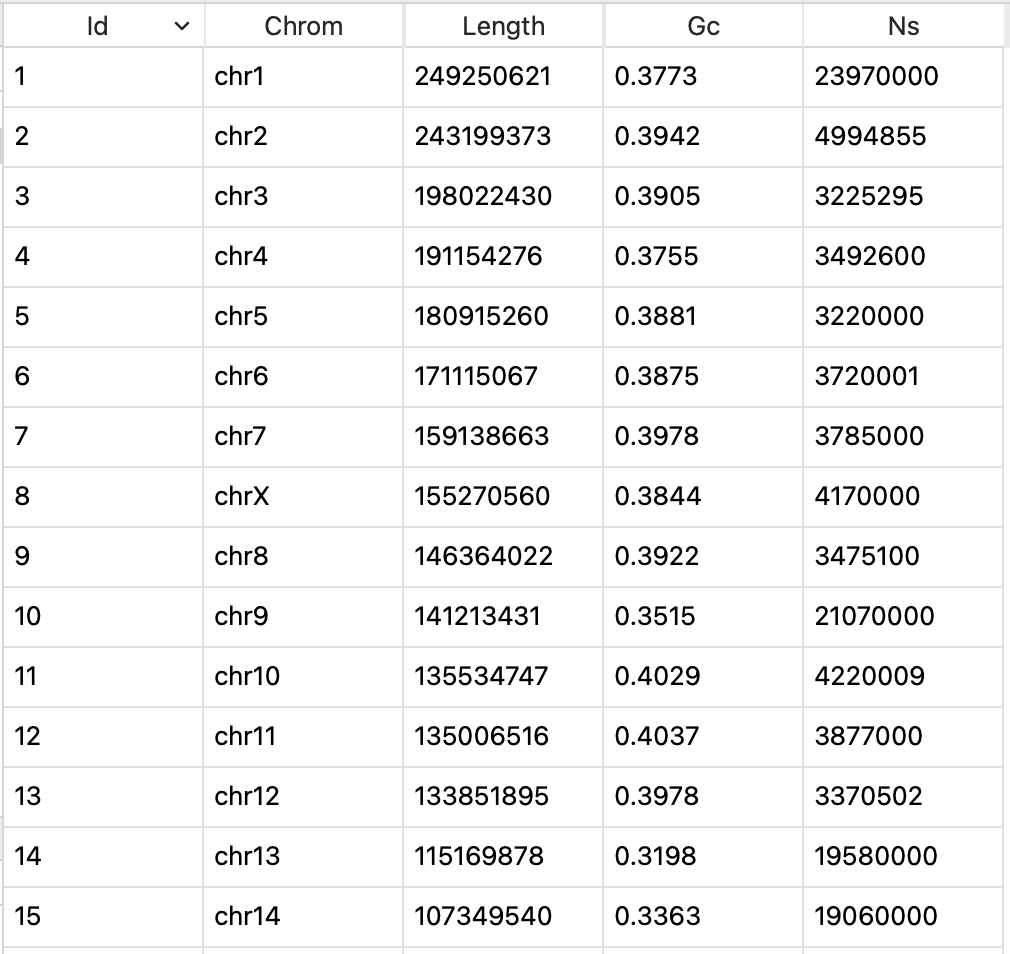
View of imported genome data
Note
The imported genome data will be assigned data type of genome.
Import Genome Annotation
The annotation data can be used to prepare circos plot data.
Go to File menu -> Import Data -> Import Genome Annotation to select a GTF or GFF file to import. The GTF or GFF file can be gzip compressed.
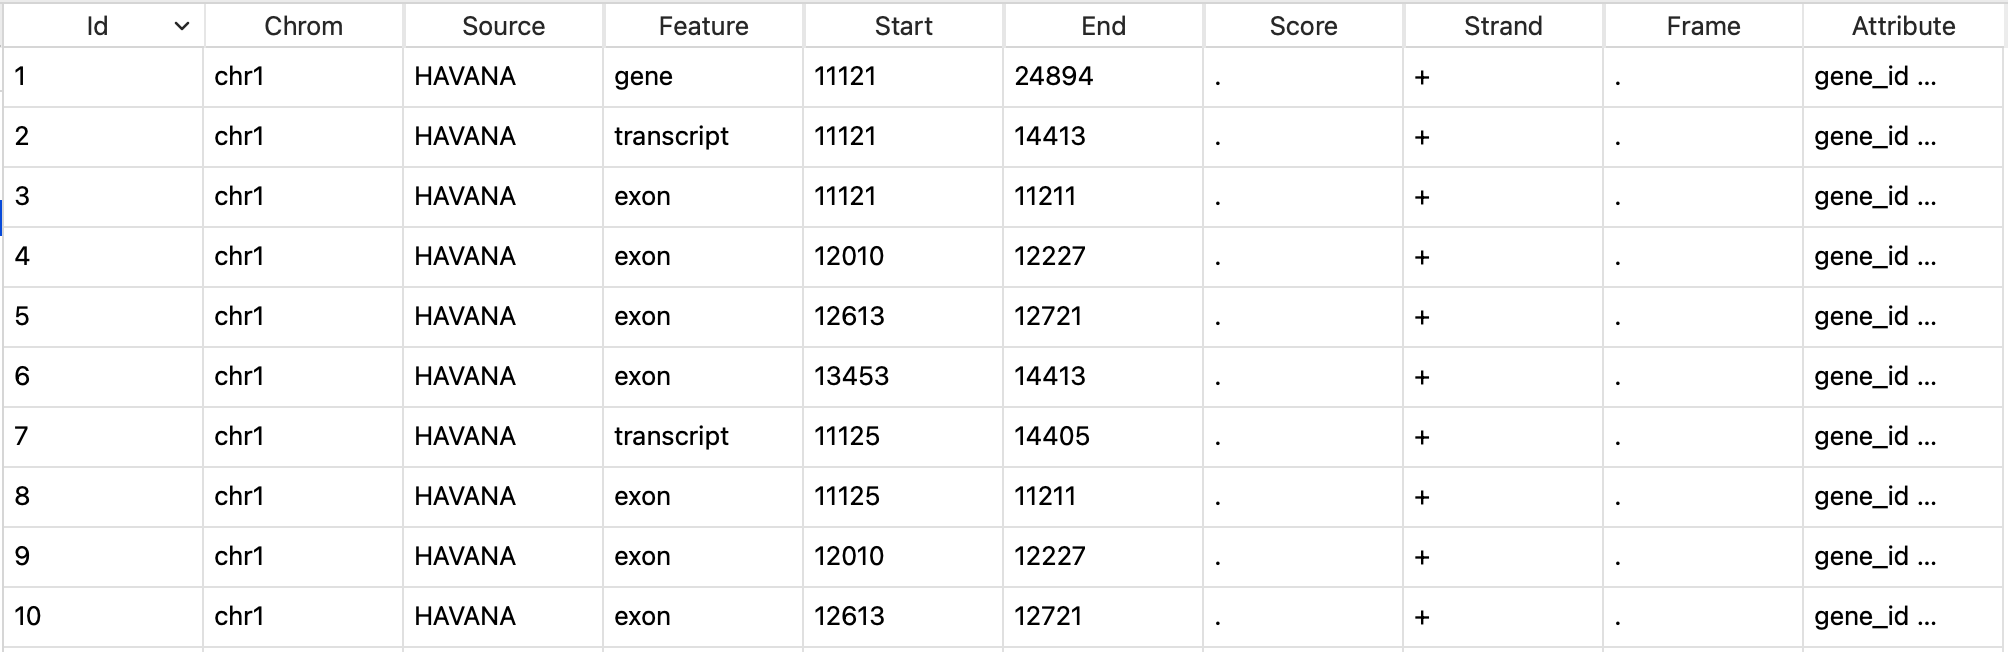
View of imported annotation data
Note
The entire annotation file will not be loaded into circhart. It will read the first 1000 lines to get feature and attribution information. The imported data will be assigned data type of annotation.
Import Genome Bands
The genome bands can be used to prepare band data for circos plotting. Not all species have genome bands. You can go to UCSC to download genome bands.
Go to UCSC Genome Table Browser.
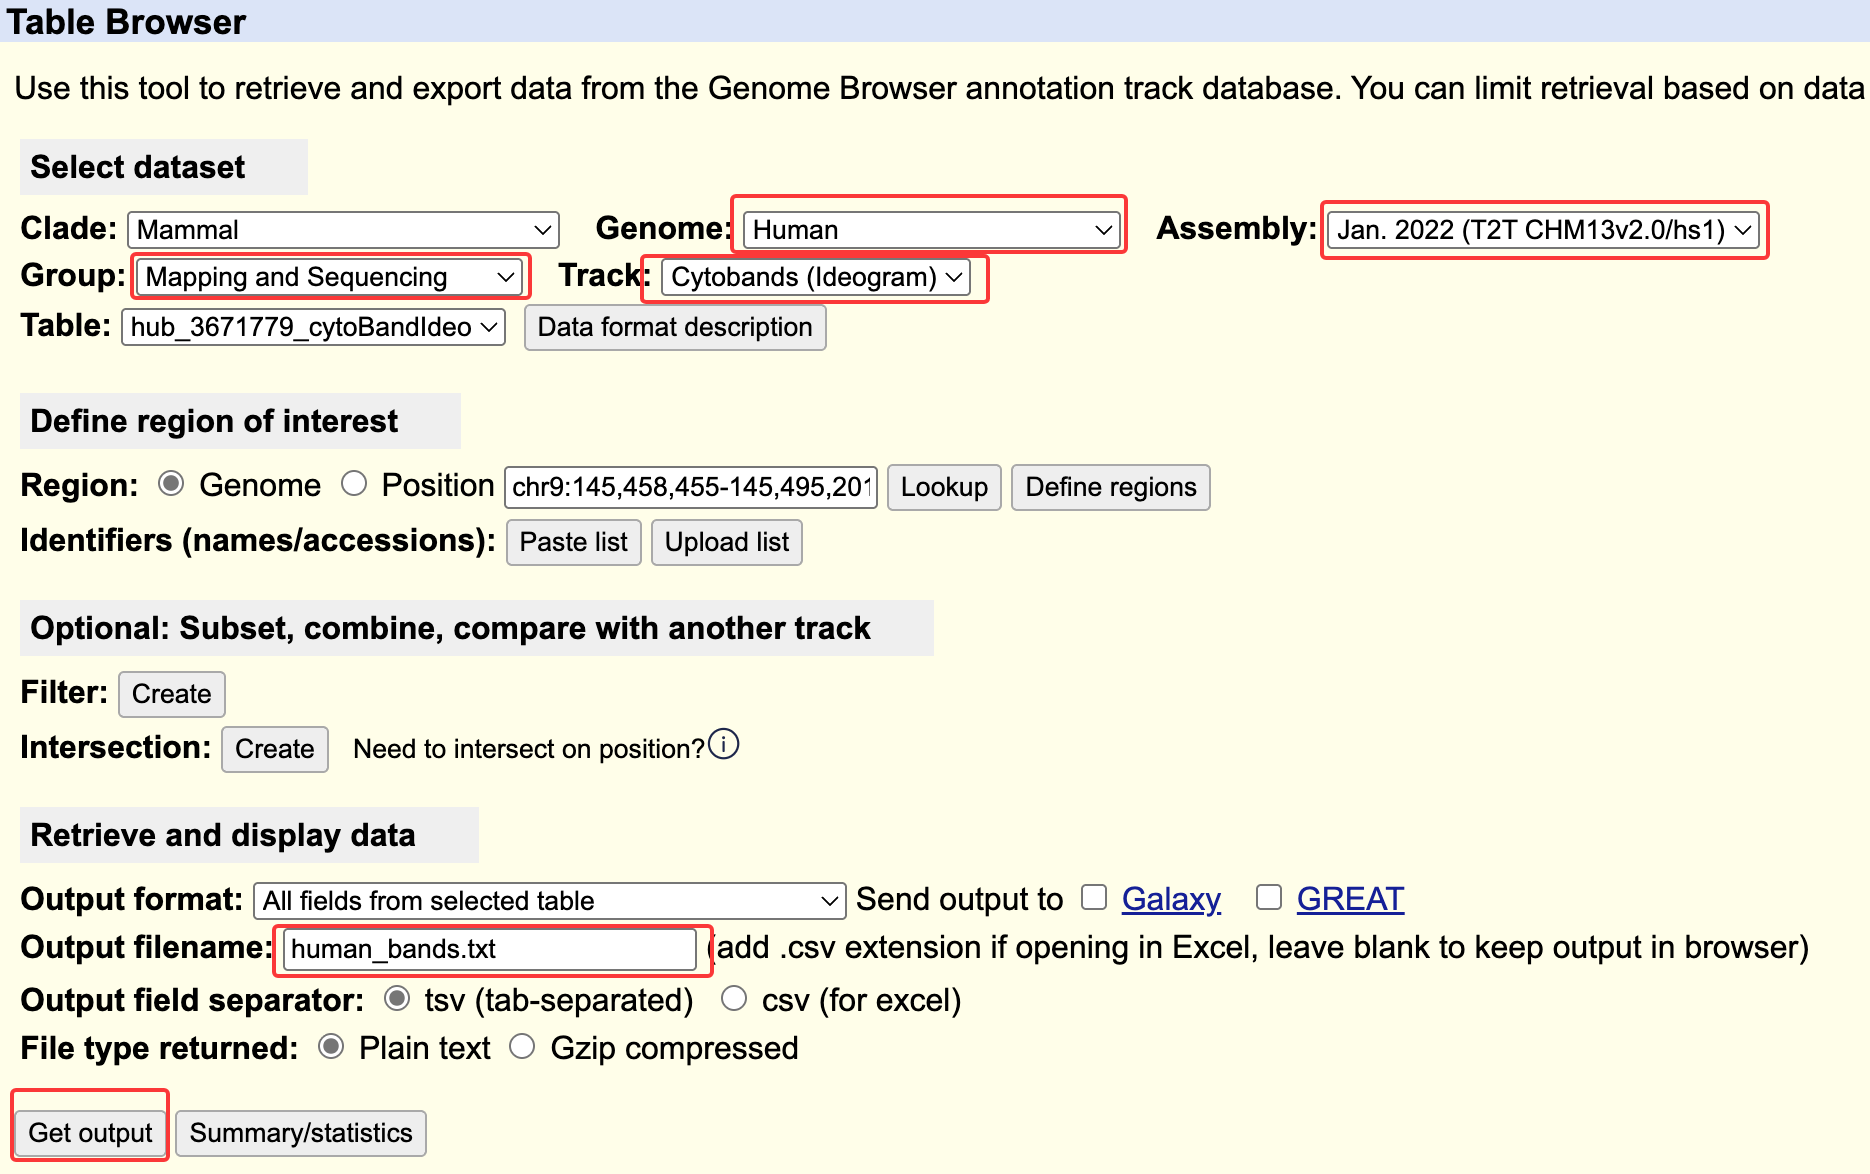
UCSC Genome Table Browser
Select a genome and assembly you desired.
Select Mapping and Sequencing for Group.
Select Cytobands (Ideogram) or Chromosome Band (Ideogram) for Track.
Input output filename
Click
Get outputbutton to download genome bands.Go to File menu -> Import Data -> Import Genome Bands… to select downloaded bands file.
The imported genome bands has five columns: chrom, start, end, name, stain.
Column |
Description |
|---|---|
id |
uniq id generated by circhart |
chrom |
chromosome name |
start |
start position |
end |
end position |
stain |
stain color name |
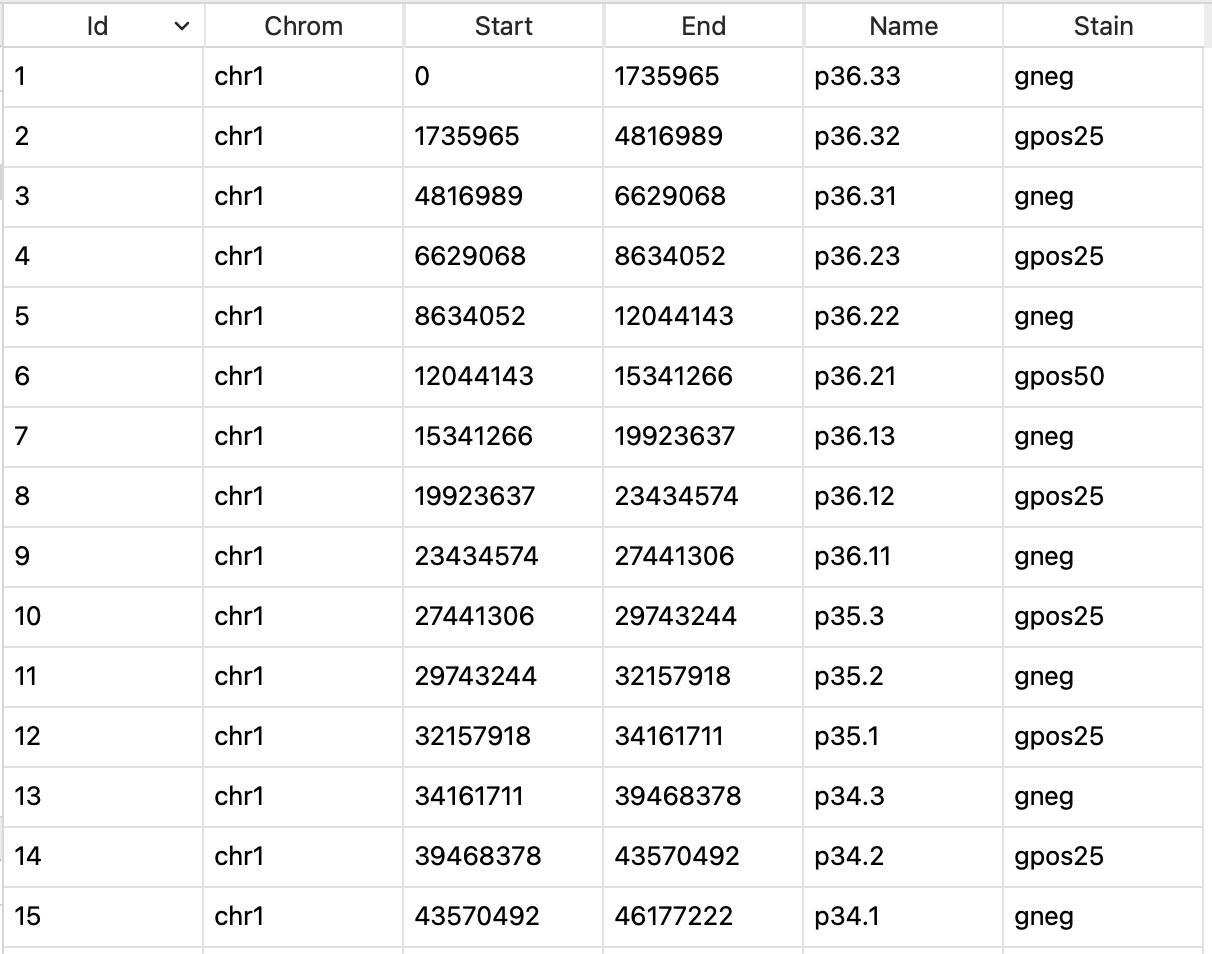
View of genome bands
Import Genome Variations
The genome variation data can be used to prepare circos plot data.
Go to File menu -> Import Data -> Import Genome Variations to select a VCF file to import variations. The VCF file can be gzip format.
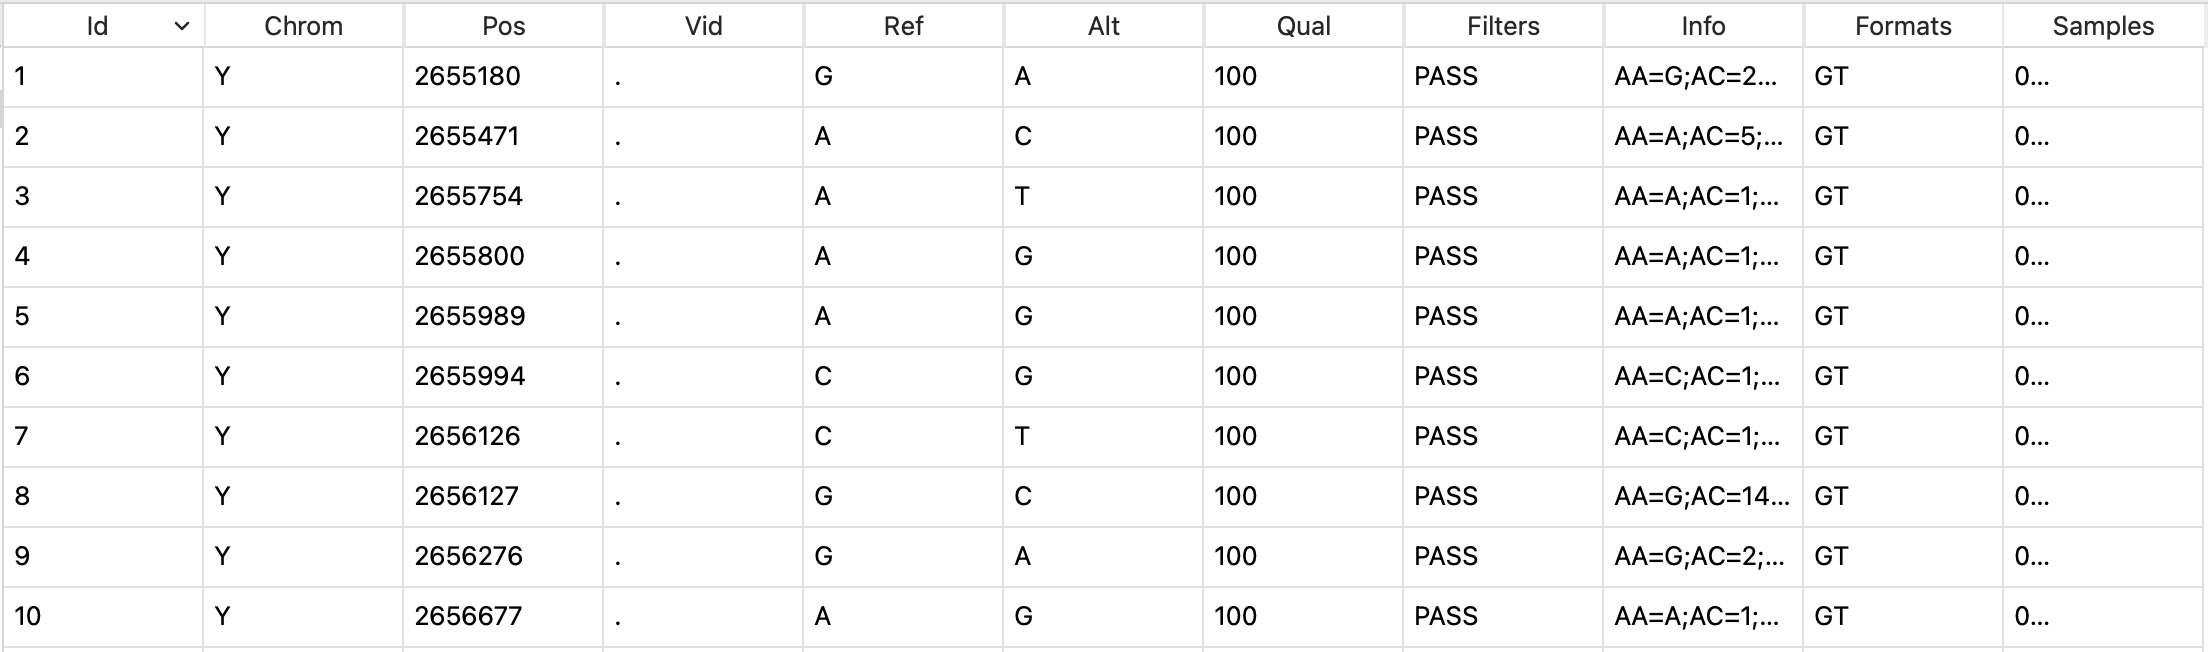
View of imported variation data
Note
Similarly, Circhart will read the first 1000 lines. The imported data will be assigned data type of variations.
Import Genome Regions
The genome region data can be used to prepare circos plot data. The genome region data is generally stored as BED format.
Go to File menu -> Import Data -> Import Genome Regions to select a BED file to import regions. The BED file can be gzip format.
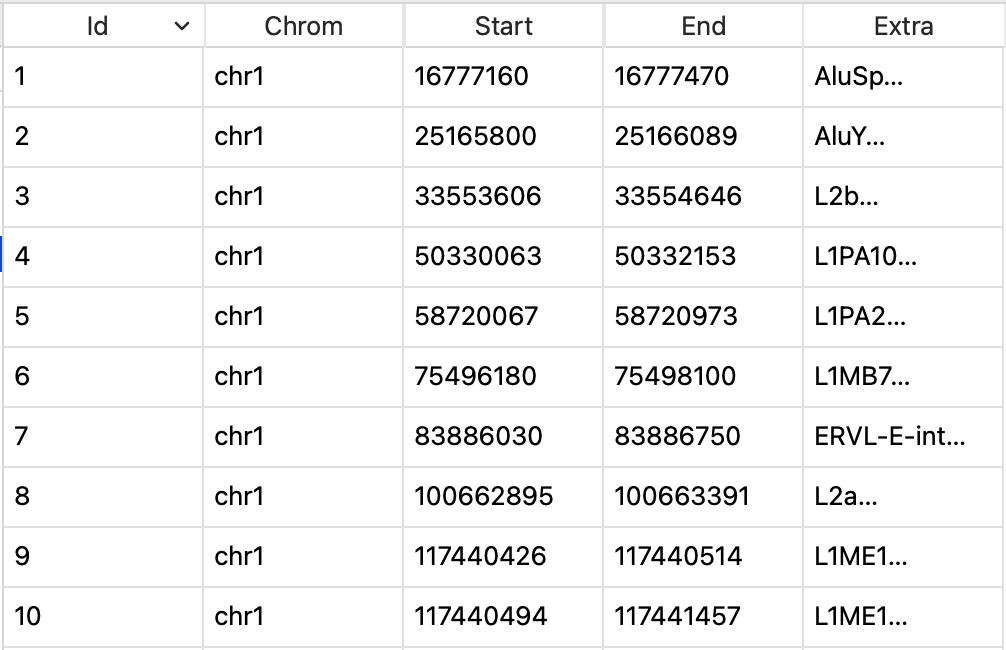
View of imported bed data
Note
Similarly, Circhart will read the first 1000 lines. The imported data will be assigned data type of
regions.
Import collinearity file
The collinearity file is the result of synteny analysis generally generated by MCScanX and can be used to prepare link data for circos plotting.
The collinearity file contains contents like this:
############### Parameters ###############
# MATCH_SCORE: 50
# MATCH_SIZE: 5
# GAP_PENALTY: -1
# OVERLAP_WINDOW: 5
# E_VALUE: 1e-05
# MAX GAPS: 25
############### Statistics ###############
# Number of collinear genes: 647, Percentage: 2.91
# Number of all genes: 22209
##########################################
## Alignment 0: score=314.0 e_value=1.6e-07 N=7 em01&em01 plus
  0-  0:        EMA01G00523.1   EMA01G03472.1         0
  0-  1:        EMA01G00527.1   EMA01G03477.1    1e-138
  0-  2:        EMA01G00530.1   EMA01G03478.1     4e-88
  0-  3:        EMA01G00534.1   EMA01G03481.1         0
  0-  4:        EMA01G00535.1   EMA01G03482.1         0
  0-  5:        EMA01G00542.1   EMA01G03487.1    4e-113
  0-  6:        EMA01G00543.1   EMA01G03509.1         0
## Alignment 1: score=316.0 e_value=1.7e-09 N=7 em01&em02 plus
  1-  0:        EMA01G02065.1   EMA02G01577.1     3e-40
  1-  1:        EMA01G02067.1   EMA02G01579.1     1e-21
  1-  2:        EMA01G02072.1   EMA02G01583.1         0
  1-  3:        EMA01G02081.1   EMA02G01586.1         0
  1-  4:        EMA01G02101.1   EMA02G01593.1     4e-43
  1-  5:        EMA01G02103.1   EMA02G01594.1    4e-109
  1-  6:        EMA01G02105.1   EMA02G01595.1     1e-46
## Alignment 2: score=542.0 e_value=3.3e-24 N=12 em01&em02 minus
  2-  0:        EMA01G01974.1   EMA02G01686.1     6e-60
  2-  1:        EMA01G02000.1   EMA02G01682.1     1e-62
  2-  2:        EMA01G02013.1   EMA02G01677.1    2e-167
  2-  3:        EMA01G02014.1   EMA02G01676.1     1e-67
  2-  4:        EMA01G02018.1   EMA02G01673.1     5e-19
  2-  5:        EMA01G02019.1   EMA02G01671.1     4e-28
  2-  6:        EMA01G02022.1   EMA02G01669.1     3e-41
  2-  7:        EMA01G02023.1   EMA02G01667.1     7e-78
  2-  8:        EMA01G02025.1   EMA02G01663.1     1e-86
  2-  9:        EMA01G02027.1   EMA02G01660.1     2e-59
  2- 10:        EMA01G02032.1   EMA02G01650.1    2e-121
  2- 11:        EMA01G02033.1   EMA02G01649.1     2e-60
## Alignment 3: score=269.0 e_value=1.7e-06 N=6 em01&em03 minus
  3-  0:        EMA01G02962.1   EMA03G02081.1         0
  3-  1:        EMA01G02963.1   EMA03G02068.1     9e-18
  3-  2:        EMA01G02966.1   EMA03G02066.1         0
  3-  3:        EMA01G02969.1   EMA03G02064.1         0
  3-  4:        EMA01G02972.1   EMA03G02058.1     3e-29
Go to File menu -> Import Data -> Import Collinearity File to select a collinearity file to import.
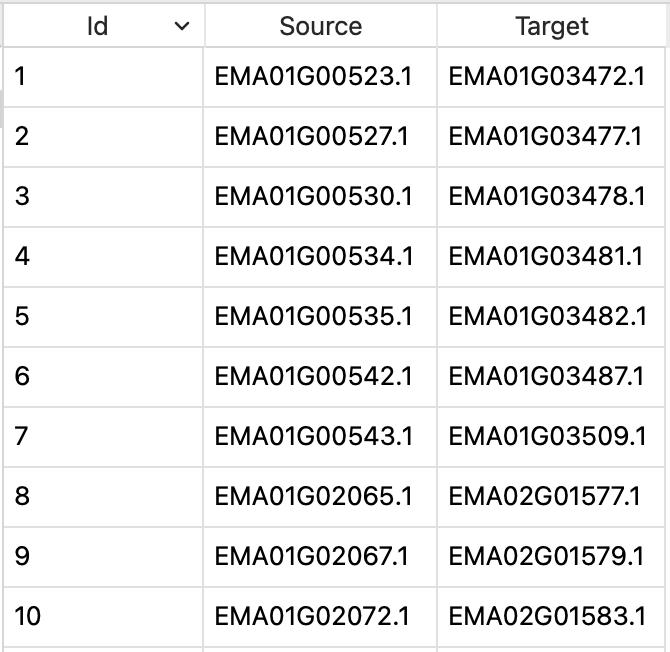
View of collinearity data