Draw Circos Plot
Create Circos Plot
Go to Plot menu -> Circos Plot -> Create Circos Plot or Click the “Create Circos Plot” icon on the toolbar to open circos plot creation dialog.
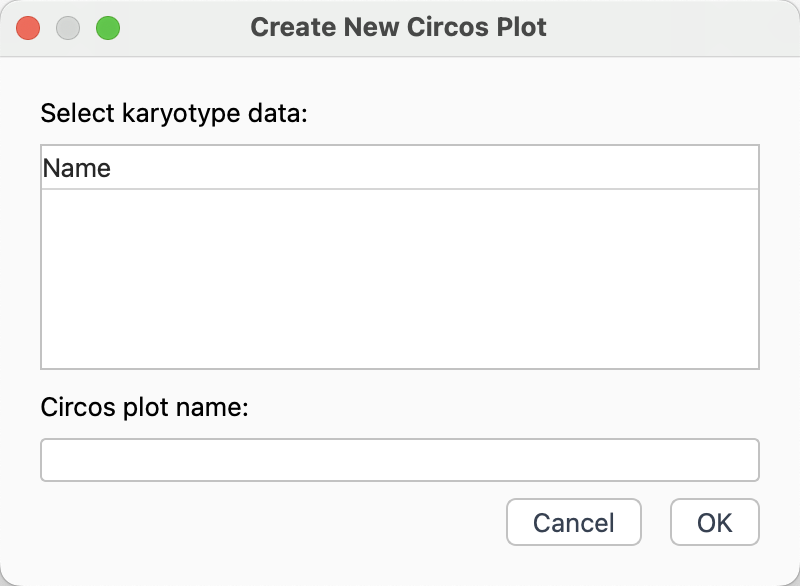
Circos plot creation dialog
Select karyotype data.
Input a name for the created circos plot.
Click
OKbutton to create circos plot.
Add Circos Track
Go to Plot menu -> Circos Plot -> Add Circos Track to add a plot track.
Or click the Add Circos Track icon on the toolbar to add a plot track.
Update Circos Plot
Every time you modify the drawing parameters, you should redraw the circos plot to update the display.
Go to Plot menu -> Circos Plot -> Update Circos Plot to redraw circos plot.
Or click Update Plot icon on the toolbar to redraw circos plot.
Circos Ideogram Parameters
Ideogram Style
The parameters for drawing ideograms can be found in Circos documentation: https://circos.ca/documentation/tutorials/reference/ideogram/

Ideogram parameters
Tip
Generally, we set radius < 1.0 to leave some blank space for putting the ideogram labels and ticks.
Ideogram Bands

Ideogram band parameters
You can toggle Show Bands to show or hide ideogram bands. If you have no bands information in your karyotype data. You can prepare it and then select it in Band Data.
Note
Band Data is an optional. Sometimes, your imported karyotype may contains genome band information.
Ideogram Labels

Ideogram label parameters
You can toggle Show Label to show or hide ideogram labels.
Some parameters that require special explanation:
Label radius: radial position of ideogram label. The label can be put to the outer, inner, or inside ideogram.Tip
You are allowed to set an offset (pixel) to fine-tune the label position.
Label format: show text of label or name column in karyotype data.Label center: the label to be centered at the radius.Label parallel: toggles the ideogram label to be parallel to the ideogram segment.
Ideogram Specific Spacing
You are allowed to set specific spacing between adjacent ideograms. You can use right-click menu on the ideogram specific spacing panel to add spacing. You can select two ideograms or chromosomes to add specific space between them.

Specific ideogram spacing parameters
Between: select two adjacent ideograms.Tip
If the two ideograms you select are the same, the space will be added on both sides of that ideogram.
Spacing: its value represents a multiple of the default spacing.
Ideogram Specific Radius
You are allowed to set specific radius for selected ideograms. You can use right-click menu on the ideogram specific radius panel to add radius. You can select a chromosome to add specific radius.

Specific ideogram radius parameters
Chrom: select a chromosome or ideogram.Radius: the specific radius value.
Circos Tick Parameters
Tick Display
The tick parameters for circos can be found in Circos documentation.

Tick parameters
Show ticks: toggle to show or hide ticksShow tick labels: toggle to show or hide tick labelsChromosome units: it is an important parameter for drawing tick marks. Default value of 1000000 means 1 unit(u) = 1Mb.Tick radius: it is the same withLabel radius, control the tick position.Label multiplier: it is a constant used to multiply the tick value to obtain the tick label. For example, the default multiplier is 1e-6 (10-6), then the tick mark at position 10,000,000 will have a label of 10.Orientation: controls whether the ticks and labels face out (orientation=out) or in (orientation=in)
Tick Marks
Even if you turn on Show ticks and Show tick labels, you may not see any tick marks unless you add them. On the tick mark panel, you can use right-click menu to add tick mark.

Tick mark parameters
Spacing: the most important parameter to control tick mark display. It is a multiplier ofchromosome units, for example chromosome units = 1Mb, spacing = 50 indicates that a mark is drawed every 50 Mb.Show label: toggle to show or hide tick mark label.Suffix: add suffix for tick mark label, the label is obtained byposition * label multiplier, when multiplier = 1e-6, the obtained label can be added with unit (mb).
Circos Plot Parameters
Plot Track Panel
Circhart allows you to draw scatter, line, histogram, stacked (histogram), heatmap, tile, text, connector, highlight and link plot tracks. You can adjust the plot parameters in track panel.

Plot track parameter panel
Track Tabs
The track panel contains four tabs:
Tab |
Description |
|---|---|
|
main paramter tab for drawing plot |
|
rule tab for controlling plot display using conditions |
|
axes tab for adding axis grids to plot track |
|
background tab for adding background color to plot track |
Track Radius
In main tab, you can change the plot Type and select plot Data. Except for link track, the other tracks require a specified position. Circos uses two radius: radius0 (R0) and radius1 (R1) to control the position and thickness of the plot tracks.

Radius of plot track
Track Radius Offset
The radius supports setting an offset value to fine-tune the radius position. You can click the ![]() button to open offset input box where you can input a number (pixel).
button to open offset input box where you can input a number (pixel).

Radius offset of plot track
Track Rules
In the rule panel, you can control the display of plot according to specified conditions. You can use right-click menu to add rule. In rule conditions, you can click ![]() to add a new condition, you can click
to add a new condition, you can click ![]() to delete the last condition. Similarly, in rule styles, you can click
to delete the last condition. Similarly, in rule styles, you can click ![]() to add a new style, you can click
to add a new style, you can click ![]() to delete the last style.
to delete the last style.

Display rules of plot track
Track Axes
In the axes panel, you can add the axis grids for the plot track.

Axis grids of plot track
There are two ways to add axis grids:
Right-click menu -> Add Spacing Axis -> Input a spacing value. For example, spacing=0.2 means that the axis will be drawed every 20% thickness of plot track.
Right-click menu -> Add Fixed Position Axis -> Input a position value. For example, position=0.5 means that the axis will be drawed at 50% thickness of plot track.
Track Background
In the background panel, you can add background with color for the plot track.

Background of plot track
You can use y0 (start position) and y1 (end position) to control the background position. For example, y0=0 and y1=0.5 means that the background will be drawed from 0% thickness to 50% thickness of plot track.
Scatter Plot Track
If you select plot type of scatter, you are only allowed to select data from type of plotdata. The parameter description can be found in Circos Documentation.

Scatter plot parameters
Line Plot Track
If you select plot type of line, you are only allowed to select data from type of plotdata. The parameter description can be found in Circos Documentation.

Line plot parameters
Histogram Plot Track
If you select plot type of histogram, you are only allowed to select data from type of plotdata. The parameter description can be found in Circos Documentation.

Histogram plot parameters
Stacked Plot Track
Stacked plot is essentially a histogram plot as well. Whereas, you should select data from type of textdata. The value column has multiple values separated by comma like this:
hs1 0 1999999 113.0000,20.0000,7.0000,40.0000
hs1 2000000 3999999 34.0000,0.0000,0.0000,0.0000
hs1 4000000 5999999 2.0000,0.0000,0.0000,0.0000
hs1 6000000 7999999 1.0000,4.0000,0.0000,0.0000
hs1 8000000 9999999 2.0000,5.0000,4.0000,0.0000
hs1 10000000 11999999 0.0000,1.0000,0.0000,0.0000
hs1 12000000 13999999 148.0000,2.0000,0.0000,0.0000
hs1 14000000 15999999 2.0000,0.0000,0.0000,0.0000
hs1 16000000 17999999 162.0000,1.0000,5.0000,1.0000
hs1 18000000 19999999 2.0000,0.0000,0.0000,0.0000
...

Stacked histogram plot parameters
In stacked plot panel, you can select a fill color for each value as different category. In Fill color, you can click ![]() to add multiple colors. You are also allowed to use right-click menu on fill colors to remove colors.
to add multiple colors. You are also allowed to use right-click menu on fill colors to remove colors.
Heatmap Plot Track
If you select plot type of heatmap, you are only allowed to select data from type of plotdata. The parameter description can be found in Circos Documentation.

Heatmap plot parameters
If you set scale_log_base, the mapping will be logarithmic. If scale_log_base <1, the dynamic range of color mapping of small values will be increased. If scale_log_base >1, then dynamic range of large values will be increased.
You can select multiple colors by clicking ![]() for value mapping. You are also allowed to use right-click menu on colors to remove colors.
for value mapping. You are also allowed to use right-click menu on colors to remove colors.
Tile Plot Track
If you select plot type of tile, you are only allowed to select data from type of locidata. The parameter description can be found in Circos Documentation.

Tile plot parameters
Text Plot Track
If you select plot type of text, you are only allowed to select data from type of textdata. The parameter description can be found in Circos Documentation1 and Circos Documentation2.

Text plot parameters
You can toggle Show Links to show label links. You can toggle Label Snuggle to set parameters for lable snuggle.
Connector Plot Track
Connectors are articulated line segments that link two points on an ideogram, with both points located between the same two radial positions.
If you select plot type of connector, you are only allowed to select data from type of locidata. The parameter description can be found in Circos Documentation.

Connector plot parameters
Highlight Plot Track
Highlights are a special type of track in Circos, used to mark or emphasize specific regions of the generated image.
If you select plot type of highlight, you are only allowed to select data from type of locidata. The parameter description can be found in Circos Documentation.

Highlight plot parameters
You can toggle Ideogram to put highlight plot onto ideograms. Highlights are drawn underneath any grids and other data, you can toggle Topmost to draw highlights on top of data.
Link Plot Track
The link track can be used to show the relationships between positions on chromosomes.
If you select plot type of link, you are only allowed to select data from type of linkdata. The parameter description can be found in Circos Documentation.

Link plot parameters
You can toggle Ribbon to make a link to be a ribbon. Its thickness is variable and scaling smoothly across its length.